For senior executives and owners
Cost reduction that lasts
A framework for taking cost out and keeping it out, drawn from twenty years of performance improvement work with companies, private equity funds and their portfolio companies.
- The stages, and what has to be finished before the next one starts
- How to find cost opportunities, and how to prioritise what you find
- Why most programs fall short of their targets, and the reasons behind it
Sent as a PDF by email. Your details are not passed on.
As featured in
- Forbes
- Financial Review
- Expert360
- Clutch
- Eloquens
The failure rate
The record of cost reduction programs
In a survey of C-suite executives cited in the report, almost every business had attempted a cost reduction program, and most had not met the target they set for it.
90%
had attempted a cost reduction program.
75%
failed to meet their targets.
44%
missed them by more than half.
Source: survey of C-suite executives, Bain & Company (April 2018), cited in the report.
The reasons cost reduction programs fail
Unrealistic targets
An arbitrary target can set a program up to fail from the outset. A target that is too modest produces a program that does not go far enough, while an across-the-board target on a cost base that is largely under long-term contract or structurally fixed tends to cost the program its early momentum.
Cuts that go too deep
Where large savings are targeted within a short timeframe, headcount tends to be reduced before the underlying workload has been, which leaves staff over-stretched and customer outcomes poorer. Savings made this way are often unwound within a year or two of the program finishing.
Execution challenges
Estimates of transformation failure rates in large organisations range from 50% to 90%. The usual causes are a lack of alignment between stakeholders, unclear planning, inadequate tracking of delivery, and limited collaboration across the business.
Loss of momentum
After the launch, the remaining initiatives tend to become progressively harder to secure. A common trigger is the withdrawal of external consultants without an adequate handover to the internal team.
The framework
The stages, run in order
Stage 1
Set targets
A high-level breakdown of the cost base by type and division, with a target for each area based on how far its costs can be compressed.
- Top-down requirement
- High-level cost mapping
- External benchmarking
Stage 2
Identify opportunities
As many opportunities as can be found, each treated as a stand-alone initiative, then prioritised on potential value against speed of delivery.
- Driver-based analysis
- Value chain mapping
- Spans and layers analysis
- RACI analysis
Stage 3
Design initiatives
The assumptions behind each opportunity validated, then a business case and a project plan for each initiative. Opportunities that can deliver early are fast-tracked, and can fund the remainder of the program.
- Opportunity validation
- Quick win delivery
- Business cases
- Initiative plans
Stage 4
Deliver initiatives
Delivery tracked against the milestones and the financial benefits in each plan. Some initiatives will be delayed or fall short, and the tracking is there to identify the variance early enough for mitigating action.
- Initiative tracking
- Financial tracking tool
- Mitigating actions
Underneath every stage
The Value Delivery Framework, which links the objectives and financial targets to the program plan and the tracking system, with governance arrangements under which the senior executives take an active role in overseeing the design and delivery of the program.
Stage two, in detail
Ways to find the cost
Most businesses now run lean and have few surplus staff, so the remaining cost tends to be concealed in complex processes and in the way operations are configured.
Benchmarking
Key metrics and ratios, such as rates or spend per full-time employee, compared with best practice.
Driver-based analysis
The relationship between a cost and the outcome it buys, taken as far as zero-based budgeting where it is warranted.
Process mapping
Unnecessary complexity or inefficiency along the value chain, and the potential for automation or outsourcing.
Spans and layers
The shape of the hierarchy, and the reporting layers that have accumulated inside it.
RACI mapping
Unnecessary complexity or duplication in decision-making processes, which tends to slow decisions.
Cost opportunity repository
The firm's repository of cost reduction opportunities by sector and functional area, built up over twenty years of engagements.
The report
The framework you can work from.
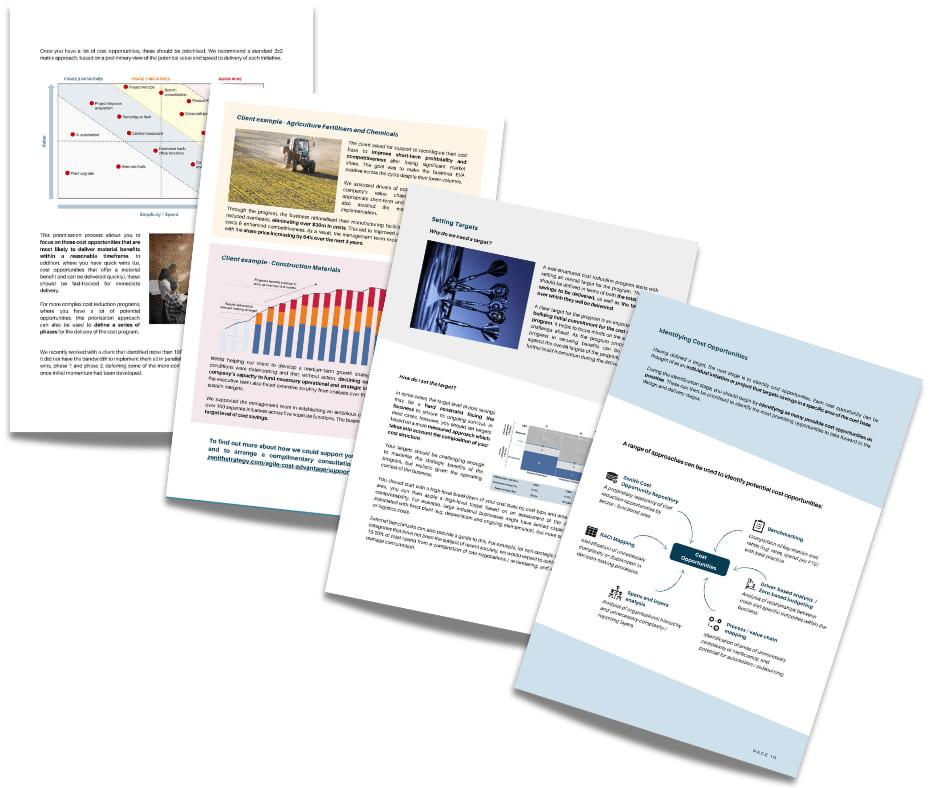
The framework in full, with the tools for each stage and the reasons programs fall short, written for the management team that has to run it.
It opens on why programs fail, with two examples from the firm's work of cost programs that did harm, including a branch closure program in which the revenue lost exceeded the cost removed.
Then the stages in order, each with the analysis behind it, the prioritisation matrix, and what each business case and initiative plan should set out.
It closes on delivery, covering the tracking that identifies a delayed initiative early and the governance that keeps the program owned within the business.
From the engagements
Programs described in the report
In each of the programs the report describes, a smaller, more senior team provided the tools and frameworks, and the management team delivered the results itself.
Financial services
34%
Share price outperformance against the broader market index over the nine months after the program began. Eight workstreams and more than 100 initiatives, including 24 near-term quick wins worth over $15m in initial profit impact.
Fertilisers and chemicals
Over $30m
Of cost eliminated by rationalising manufacturing facilities and supply points and reducing overheads. More than 100 initiatives across five functions. The management team went on to exceed market expectations.
Construction materials
EVA positive
Across the cycle, the goal set after a period of lost market share. Cost drivers assessed across the whole value chain, with short-term and long-term measures and implementation support.
The Agile Cost Advantage
Get the report
Enter your name and work email and we will send the report to your inbox.